Average error
8.55mg/week
Lower is better. Best model, public IWPC data.
WarfaRisk predicts a weekly warfarin dose and a 90% range, then checks how well that range held up for the patient's ancestry group.
Supported by


Held upFor Han Chinese patients the true dose was inside the range 100% of the time. Goal: 90%.
Warfarin is hard to dose. The right dose can differ ten times between patients, and too much or too little is dangerous.
Steps 1 to 6 are the evaluated core. Steps 7 to 9 are prototype extensions.
Fit every fix on training patients only, then run 11 checks for leaks.
Three simple methods, including the published IWPC formula.
Each one with clinical details, genes, and both together.
Train without one ancestry group, then test on it.
Check how often the real dose lands inside, by group.
Show which inputs pushed the dose up or down.
Test on hospital records with repeated INR checks.
Same tables for every group, in every result.
A short plain explanation that cites its sources.
On 1,207 test patients, every model that used genes beat the same model without them.
Average error
8.55mg/week
Lower is better. Best model, public IWPC data.
Doses within 20% of the true dose
46.6%
The usual bar is 50%. We did not reach it.
Dose variation explained
47.5%
Genes added roughly 10 to 20 points over clinical details alone.
Training and test patients never overlap.
An average says nothing about who the tool works for. So we checked.
Each dose comes with a range that should hold the true dose 9 times out of 10. Across all patients it does: 89.8%. A common shortcut, averaging five neural networks, reached only 24.9%.
| Group | Patients | Inside the range | 95% interval | Result |
|---|---|---|---|---|
| All patients | 1207 | 89.8% | not reported | Met the target |
| Korean | 53 | 96.2% | 87 to 99.5 | Met the target |
| Japanese | 170 | 95.9% | 91.7 to 98.3 | Met the target |
| White | 493 | 91.3% | 88.4 to 93.6 | Met the target |
| Chinese | 28 | 89.3% | 71.8 to 97.7 | Below target, could be chance |
| Caucasian | 124 | 86.3% | 79 to 91.8 | Below target, could be chance |
| Intermediate | 14 | 85.7% | 57.2 to 98.2 | Below target, could be chance |
| Black | 73 | 82.2% | 71.5 to 90.2 | Below target, could be chance |
| Black or African American | 52 | 69.2% | 54.9 to 81.3 | Below target, not chance |
| African-American | 24 | 62.5% | 40.6 to 81.2 | Below target, not chance |
For the two red groups, about 1 true dose in 3 fell outside the range, against about 1 in 10 overall. Every range was the same width, about 37.7 mg/week, so the tool sounded just as sure.
Ranges get wider, and groups too small to measure stay out of reach.
The tool shows which inputs pushed each dose up or down. Across patients genes carry about 64% of that weight, led by VKORC1.
Average push on the dose. Top 7 of 11 inputs, 1,780-patient cohort.
Pick a patient and follow the three screens a clinician would see. Dose, range and input effects come from the real model; group figures come from the papers. Research prototype, not for clinical use.
Example values, so they cannot be edited. Pick another patient above to see a different result.
Optional. Without genes the model uses clinical details alone.
Short answers, with the numbers from the papers.
WarfaRisk is an open research project that predicts a weekly warfarin dose with a 90% range around it, then checks how well that range held up for each ancestry group. It is described in two peer-reviewed papers from 2026 and shown here as a prototype. It is not for clinical use.
No. WarfaRisk is a research prototype, trained on public research data and not tested in patients. The dose and range shown on this page must not be used to make dosing decisions. Dosing decisions belong to a clinician.
On 1,207 test patients, the best model's average error was 8.55 mg per week, against 9.18 for the published IWPC dosing formula. 46.6% of doses were within 20% of the true dose, below the usual bar of 50%. These figures are from the Journal of Personalized Medicine paper.
No. The 90% range held for 89.8% of all patients, but for patients labelled Black or African American it held for 69.2% (52 patients), and for African-American patients 62.5% (24 patients). Both are below the 90% goal. Calibrating each group on its own raised the Black label from 82.2% to 93.2%, and Black or African American from 69.2% to 78.8%.
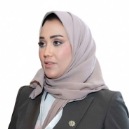
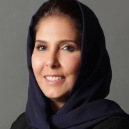
WarfaRisk is a research project from Alfaisal University and partner institutions in Saudi Arabia. The project leads are Dr. Mariam AlEissa, Dr. Areej Al-Wabil and Dr. Abdullah N. Alkattan. The team page lists everyone who worked on it, with links to their profiles.
Yes. The pipeline code, the prototype app, the interface demo and the trained models are open. Links to the papers, the code and the models are in the Papers section of this page.
Both are free to read. The code and trained models are open too.
Journal of Personalized Medicine, 2026, 16(10), 531
Accuracy, who the tool misses, how sure it is, and why, on the same patients.
Read the paperDOI 10.3390/jpm16100531
AI, 2026, 7(10), 431
The tool: the nine steps, the three screens, and what it takes to reach a clinician.
Read the paperDOI 10.3390/ai7100431
The people working on WarfaRisk.

The authors thank the Alfaisal AI Center at Alfaisal University for infrastructure support.